Test du langage LateX en html5
déc. 22, 2009· ·
1 min. de lecture
·
1 min. de lecture
Svend Walter
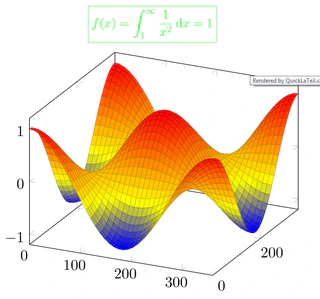
Un exemple de ce qu'il est possible de faire avec lateX en html5 :
[latexpage] At first, we sample $f(x)$ in the $N$ ($N$ is odd) equidistant points around $x^*$: \[ f_k = f(x_k),\: x_k = x^*+kh,\: k=-\frac{N-1}{2},\dots,\frac{N-1}{2} \] where $h$ is some step. Then we interpolate points $\{(x_k,f_k)\}$ by polynomial \begin{equation} \label{eq:poly} P_{N-1}(x)=\sum_{j=0}^{N-1}{a_jx^j} \end{equation} Its coefficients $\{a_j\}$ are found as a solution of system of linear equations: \begin{equation} \label{eq:sys} \left\{ P_{N-1}(x_k) = f_k\right\},\quad k=-\frac{N-1}{2},\dots,\frac{N-1}{2} \end{equation} Here are references to existing equations: (\ref{eq:poly}), (\ref{eq:sys}). Here is reference to non-existing equation (\ref{eq:unknown}). \[ \quicklatex{color="#00ff00" size=25} \boxed{f(x)=\int_1^{\infty}\frac{1}{x^2}\,\mathrm{d}x=1} \]\begin{tikzpicture} [+preamble] \usepackage{pgfplots} \pgfplotsset{compat=newest} [/preamble] \begin{axis} \addplot3[surf,domain=0:360,samples=40] {cos(x)*cos(y)}; \end{axis} \end{tikzpicture}

Auteurs
Professeur de sciences informatiques, physiques et chimiques · INSPE
Professeur de numériques et sciences informatiques physiques et chimiques au lycée, j’interviens également à l’INSPE. Je développe des projets autour du numérique éducatif, de l’esprit critique, de l’IA pédagogique et de l’égalité filles-garçons.